
Buying Models
Were Changing
The digital revolution brought with it a wave of new buying models. Subscription pricing in software and services, surge pricing in the travel, auction platforms entering the home with eBay, etc… Everywhere you looked data was having a significant impact on one of the core tenets of marketing, pricing.
The impacts of this revolution while substantial, but they were also limited to certain industries. Not everyone was well positioned to make the most of these changes, but it brought with it a level of comfort in embracing foundational change, and this was just as evident in B2B as it was with consumers.

Pant was an Unlikely Candidate
For Pricing Change
During this transformational time, one you could argue is still very much in effect, I was working for Edge Consultants with a client called Jotun paints. They had developed a new Anti Fouling paint, Sea Quantum x2000, that promised to ensure a 1% loss in speed over a 5 year inter dock period. For those unfamiliar with Anti Fouling, it is the paint applied to the hull of ocean vessels to prevent the growth of organic matter, that decreases the overall efficiency of a vessel over time.
The act of selling performance paint may not seem like a good candidate for a new pricing and selling model, but there were several aspects to Jotun's new product, and the market dynamics surrounding it, that made it perfect for rethinking.

Big Commitment
High Overheads
The biggest barrier facing Jotun was cost. To repaint a large cargo vessel can be anywhere between $2-5 million, Jotun were offering a premium product that would retail at 20-30% more than the standard anti fouling. On an fleet of vessels, this represents a significant increase in fleet maintenance costs.
Sea Quantum was offering efficiency over time, the running costs of ocean liners are significant with larger ships costing $15-20 million a year to operate. Offering a potential 14.7% saving on that over a 5 year period is significant and more than covers the initial higher overheads. The larger issue was combination of sticker shock and trust, advertising that they will save money in the long run when faced with the decision to repaint a fleet at almost a 3rd more than another available anti fouling (Hempel Classic) was a proving more difficult than Jotun first envisioned.

Don't Sell a Product
Sell a Guarantee
To counter this barriers the idea to guarantee the efficiency was floated. Jotun wouldn’t sell a product in the traditional sense, but would sell a performance guarantee for 4 years of operation. On paper this is a simple idea, but guaranteeing the performance of an ocean liner that could operate anywhere in the world is daunting. Nothing like this had been attempted before. The up side to getting it right was as ensure operating efficiency over time would ensure the investment on long term efficiency. This would all balance on our ability to create an Ocean Liner Efficiency calculator, one that could be used to validate efficiencies over time and ensure they were delivering on their promise. This would ultimately require significant amounts of data, and a renewed approach to data collection

What Does Average
Efficiency Look Like
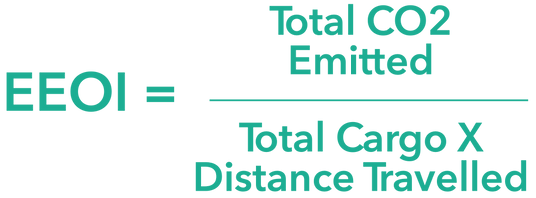
Calculating efficiency is rather simple, the total CO2 emitted over the weight multiplied by distance. Before we could begin to sell an efficiency though, we needed to have an iron clad standard performance profile. An performance benchmark that would be the yard stick by which to ensure our guarantee.
Due to the size and cost of these vessels, understanding their performance over time is vitally important this meant that all of the data we required to calculate our standard performance profile had been recorded.
Problem with Boats?
They're Always Moving
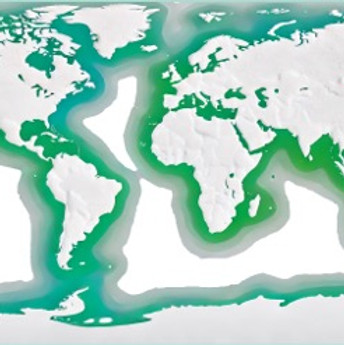
Headwind, hull profile, weight distribution, etc.. all had to be incorporated into our performance profile, but these elements were commonly incorporated into existing performance curves. The biggest issue we had to solve for was location. A vessel operating in the North Sea accumulates significantly less organic build up than one in the Caribbean, where you are in the world has an significant impact on performance over time. If we were to guarantee performance based on vessels operating in the North Sea to those in Caribbean we would be in big trouble.
To overcome this we needed not only to account for different operating territories but that the vessels would navigate between these territories. To accomplish this we divided the world oceans into distinct biomes and created performance curves. This meant that Instead of weighting against a singular expected performance profile of a vessel, performance would be calculated on a moving basis depending on where the vessel was and how long it and had operated in that territory.
Building an Ocean Liner

Efficiency Calculator
With the work of a truly fantastic Marine Engineer and the cooperation of our partners who shared vast amounts of ocean liner telemetry we had created our expected moving performance profile. We now had to create a means of calculating the ongoing performance of live vessels who were currently using Sea Quantum.
It might seem somewhat outdated by todays standards but we created an excel based calculator that would absorb the batch processed telemetry and evaluate it’s performance against the expected performance profile. It would then highlight any vessels that were not adhering to the expected performance levels. This process has been updated in more recent years to include live data feeds and a power BI interface but for our fledgling idea we built it all in excel, and the result was a tool that could be used to show the efficiency of our product over time. We were now in a position where for the first time ever in the Marine segment we could sell an efficiency of performance and not just the product
Leveraging Data
in New Ways
The ocean liner efficiency calculator has undergone a significant modernization over the years taking our fledgling batch processed excel and building it into an automated BI tool. The success of this tool has seen Jotun marine paints segment become a core driver of the company's continued growth with an CAGR of 10.2% for the period of 2013-2023.
This was an example of a truly innovative idea that didn’t need new data collection methods, or new expensive technology, and could be delivered in a relatively short space of time. All it truly required was a a collection of knowledgeable people who had the courage to break apart an existing sales dynamic and rebuild it.
